Analytics
The Analytics dashboard in OneByZero Neo provides comprehensive visibility into workspace-level metrics and resource consumption patterns. This powerful feature enables workspace administrators and team leads to monitor usage, track costs, understand consumption trends, and make data-driven decisions about resource allocation and optimization.
Understanding the Analytics Dashboard
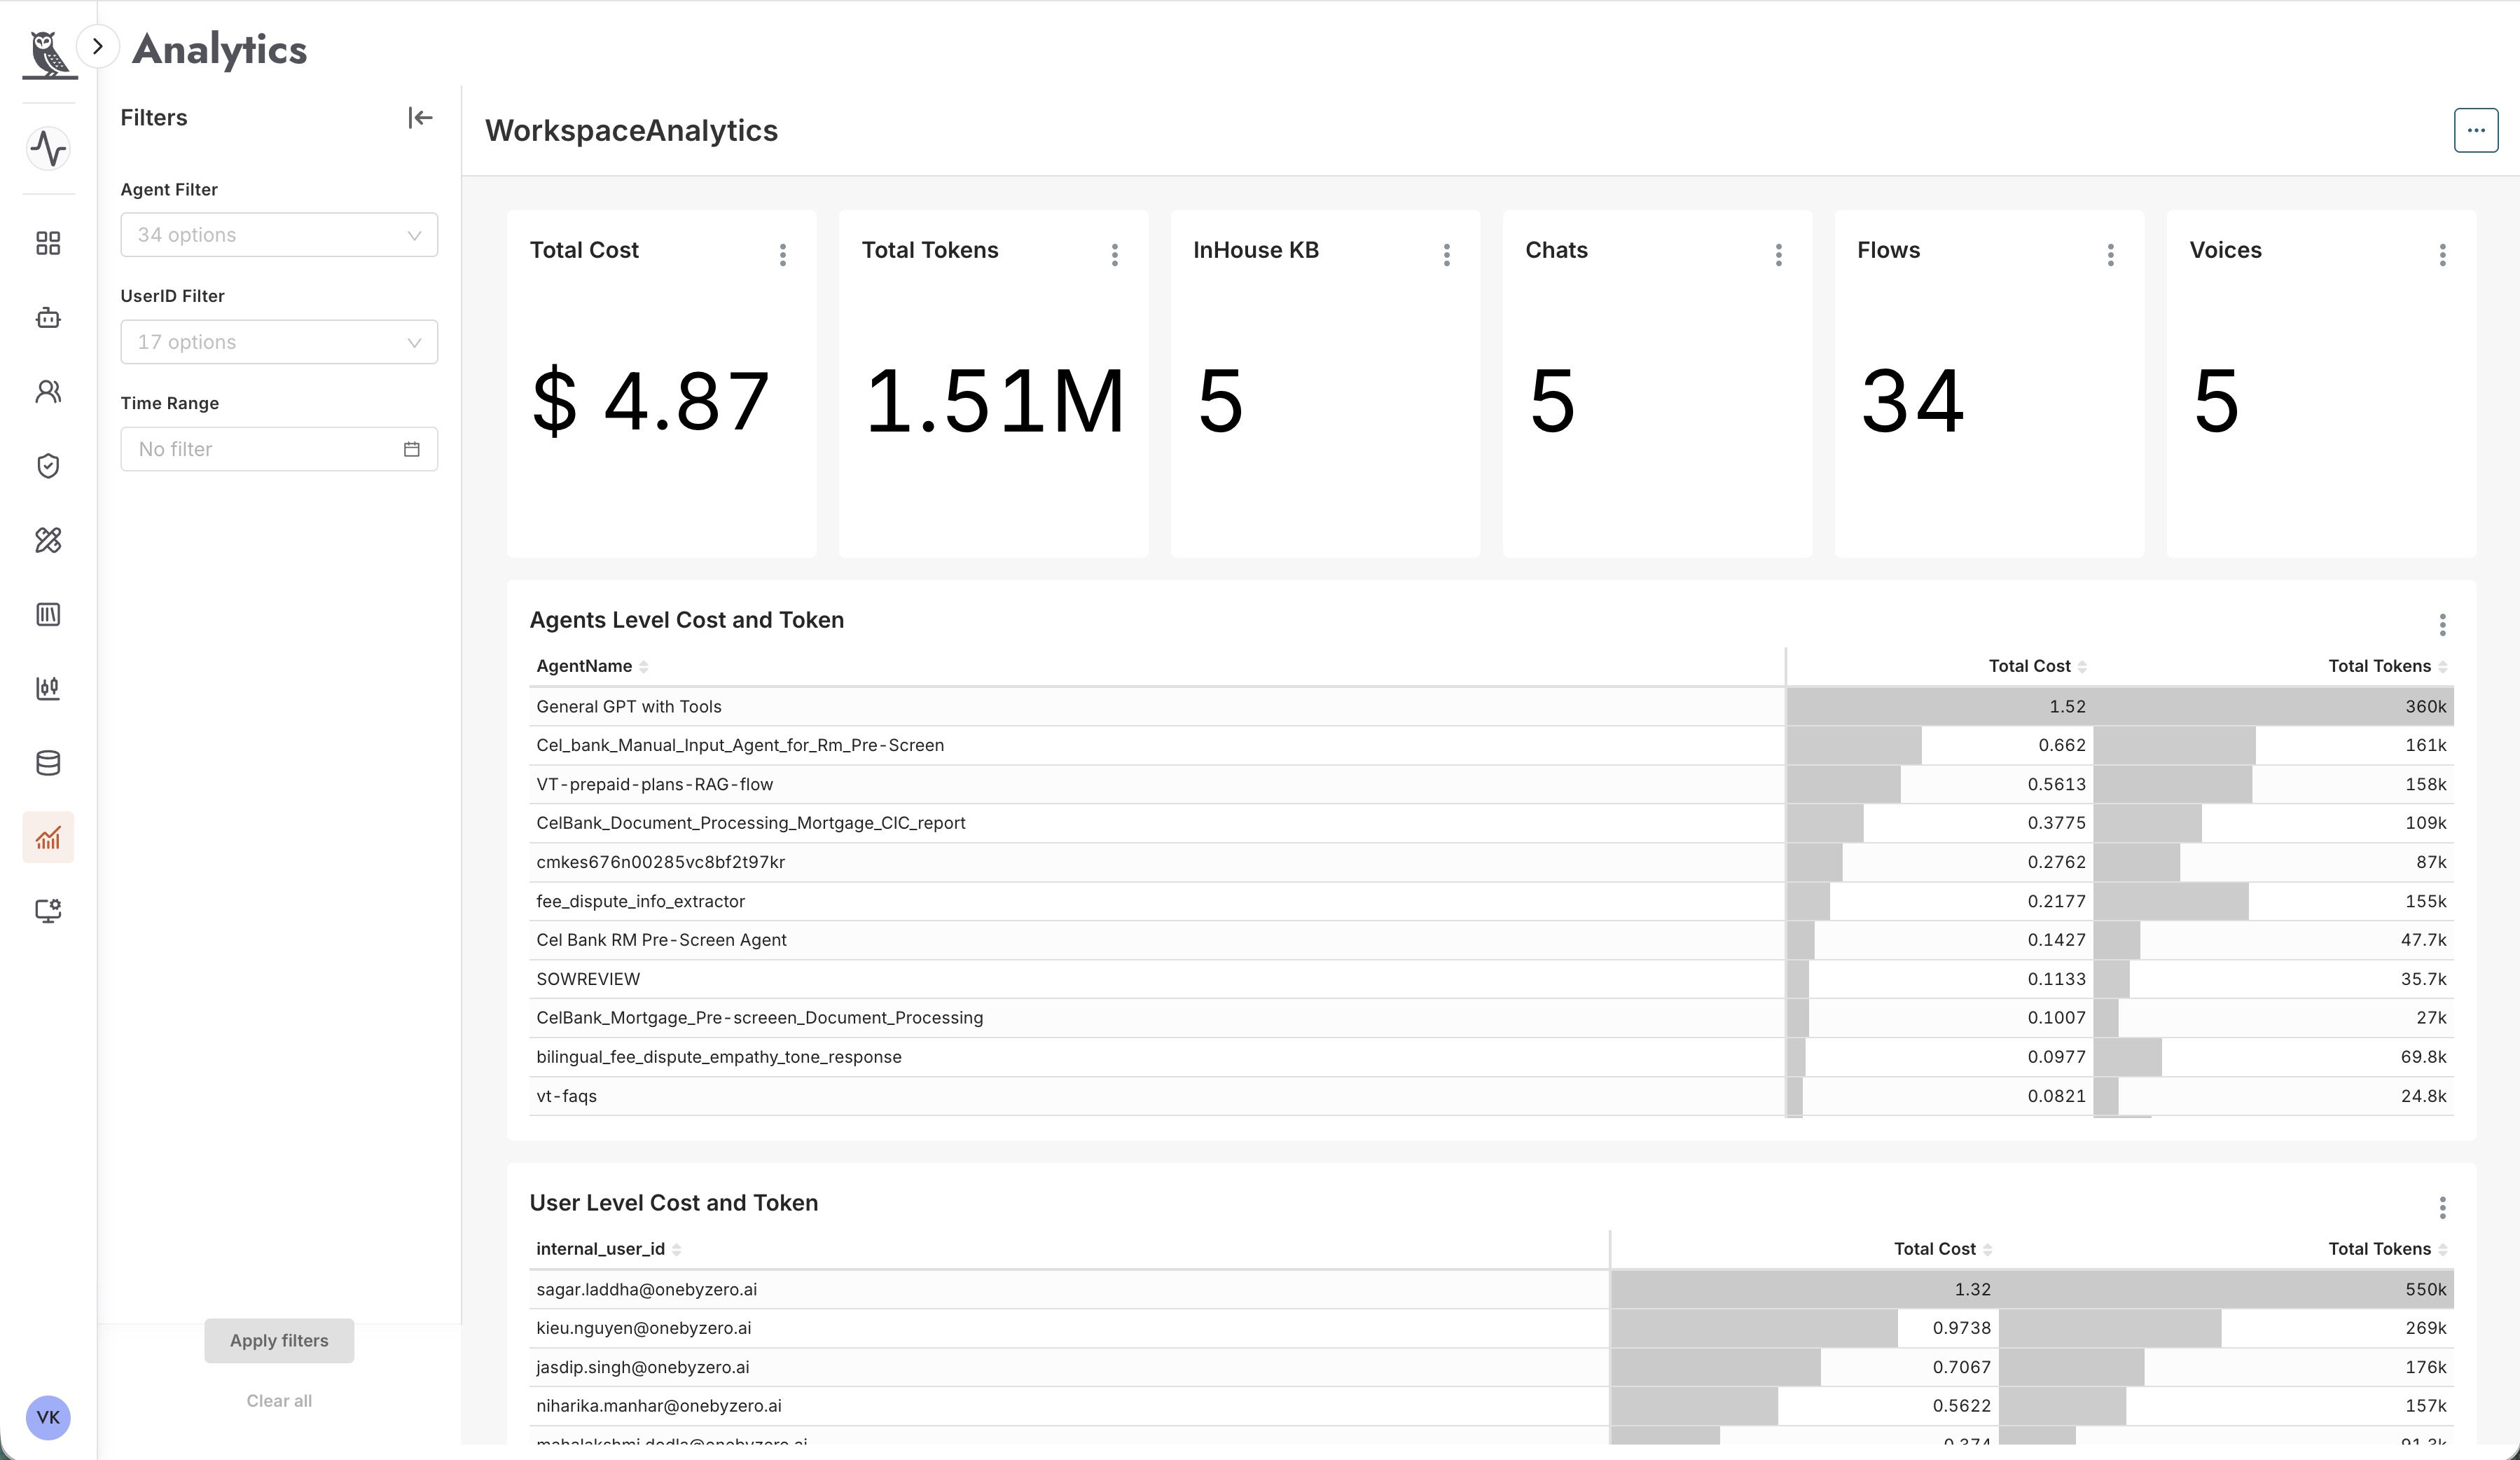
The Analytics dashboard presents a consolidated view of all activity within your workspace, aggregating data across agents, users, and time periods to provide actionable insights. The dashboard is organized into several key sections that together paint a complete picture of workspace utilization.
Workspace Analytics Overview
At the top of the dashboard, you’ll find high-level summary cards that provide at-a-glance metrics for the entire workspace:
Total Cost - The cumulative cost incurred by all agent activity within the workspace. This metric helps you track spending against budgets and identify when costs are trending higher than expected. Costs are calculated based on token consumption and the pricing of the underlying models used by your agents.
Total Tokens - The aggregate number of tokens consumed across all agents in the workspace. Token consumption is a fundamental metric for understanding LLM usage, as it directly correlates with both cost and the volume of agent interactions. The dashboard displays this in a readable format (e.g., 1.51M for 1.51 million tokens).
InHouse KB - The count of in-house knowledge bases configured within the workspace. Knowledge bases are critical resources that agents use to retrieve information, and this metric helps you track how many knowledge resources are available.
Chats - The number of chat agents deployed in the workspace. This gives you a quick count of conversational agents that are available for text-based interactions.
Flows - The number of flow agents in the workspace. Flow agents represent structured workflows and agentic processes that can be invoked by other agents or external systems.
Voices - The count of voice agents configured in the workspace. Voice agents handle telephony and voice-based interactions.
These summary cards provide immediate visibility into the scale and scope of your workspace’s AI capabilities and their associated resource consumption.
Filtering and Time Range Selection
The left side of the Analytics dashboard provides powerful filtering capabilities that allow you to drill down into specific subsets of data:
- Agent Filter
Filter the analytics data to show metrics for specific agents or groups of agents. The dropdown displays all available agents in your workspace (e.g., “34 options”), allowing you to:
Focus on a single agent to understand its specific usage patterns
Compare multiple agents side by side
Exclude certain agents from the analysis
Identify which agents are consuming the most resources
- UserID Filter
Filter by specific users to understand individual usage patterns. This filter shows all users who have interacted with agents in the workspace (e.g., “17 options”), enabling you to:
Track usage by individual team members
Identify power users who are driving significant consumption
Understand adoption patterns across your organization
Support chargeback or cost allocation processes
- Time Range
Select a specific time period for analysis. Time-based filtering allows you to:
Compare usage across different periods (daily, weekly, monthly)
Identify trends and patterns over time
Correlate usage spikes with specific events or releases
Generate reports for specific billing periods
After adjusting filters, click Apply Filters to update the dashboard with the filtered data. Use Clear all to reset filters and view the complete dataset.
Agent-Level Cost and Token Analysis
The Agents Level Cost and Token section provides a detailed breakdown of resource consumption by individual agents. This table is essential for understanding which agents are driving costs and consumption within your workspace.
The table displays the following information for each agent:
- AgentName
The name of the agent, allowing you to quickly identify which agents are included in the analysis. Agent names should be descriptive to make this analysis meaningful.
- Total Cost
The cumulative cost incurred by each agent, displayed both as a numeric value and as a visual bar chart. The bar chart provides an intuitive way to compare relative costs across agents at a glance. Agents with higher costs will have longer bars, making it easy to identify the most expensive agents.
- Total Tokens
The total number of tokens consumed by each agent. Like cost, this is displayed with visual indicators that help you quickly compare token consumption across agents.
This agent-level breakdown enables several important analyses:
Cost Attribution - Understand exactly which agents are responsible for what portion of your total costs
Optimization Targeting - Identify agents that may benefit from optimization efforts (prompt tuning, model selection, etc.)
Capacity Planning - Anticipate future costs based on agent-level consumption trends
ROI Analysis - Compare the cost of agents against the business value they deliver
For example, if you notice that a particular agent like “General GPT with Tools” is consuming significantly more resources than others, you might investigate whether this is expected based on its usage volume, or whether there are opportunities to optimize its prompts or configuration.
User-Level Cost and Token Analysis
The User Level Cost and Token section breaks down resource consumption by individual users. This analysis is valuable for understanding how different team members or customers are utilizing your AI agents.
The table displays:
- internal_user_id
The identifier for each user, typically their email address or username. This allows you to associate consumption with specific individuals or accounts.
- Total Cost
The total cost incurred by each user’s interactions with agents in the workspace.
- Total Tokens
The total number of tokens consumed by each user across all their agent interactions.
User-level analytics support several important use cases:
Usage Monitoring - Track how actively different users are engaging with AI agents
Cost Allocation - Support chargeback models where departments or teams are billed for their usage
Adoption Tracking - Identify users who may need additional training or encouragement to adopt AI tools
Anomaly Detection - Spot unusual usage patterns that might indicate issues or misuse
Capacity Management - Understand user-level demand to plan for scaling
Using Analytics for Cost Management
The Analytics dashboard is a powerful tool for managing and optimizing costs associated with your AI agents. Here are some strategies for leveraging analytics data:
- Budget Monitoring
Regularly review total cost metrics against your budget allocations. Set up a routine to check the dashboard and identify when costs are trending toward budget limits.
- Cost Optimization
Use agent-level breakdowns to identify optimization opportunities:
Agents with unexpectedly high costs may benefit from prompt optimization
Consider whether expensive agents could use more cost-effective models
Evaluate whether high-cost agents are delivering proportional business value
- Chargeback and Showback
Use user-level and agent-level data to implement cost allocation models:
Charge departments for their specific usage
Provide visibility into consumption to encourage responsible usage
Support financial planning and budgeting processes
- Trend Analysis
Use time-based filtering to identify trends:
Is usage growing, stable, or declining?
Are there predictable patterns (e.g., higher usage on certain days)?
How do costs correlate with business metrics?
Best Practices for Analytics
- Regular Review Cadence
Establish a regular schedule for reviewing analytics data. Weekly reviews help you stay on top of trends, while monthly reviews support deeper analysis and reporting.
- Set Up Alerts
If usage or costs exceed expected thresholds, investigate promptly. Unexpected spikes may indicate issues that need attention.
- Document Baseline Metrics
Record baseline metrics when you first deploy agents, and track how these metrics evolve over time. This historical context makes trend analysis more meaningful.
- Correlate with Business Metrics
Connect usage analytics with business outcomes. Understanding the relationship between agent usage and business value helps justify investments and prioritize optimization efforts.
- Share Insights
Use analytics data to communicate with stakeholders about AI adoption, costs, and value. Clear metrics help build support for AI initiatives and demonstrate return on investment.
- Use Filters Strategically
Take advantage of filtering capabilities to answer specific questions. Rather than always looking at aggregate data, drill down into specific agents, users, or time periods to uncover insights that might be hidden in the overall numbers.