Observability
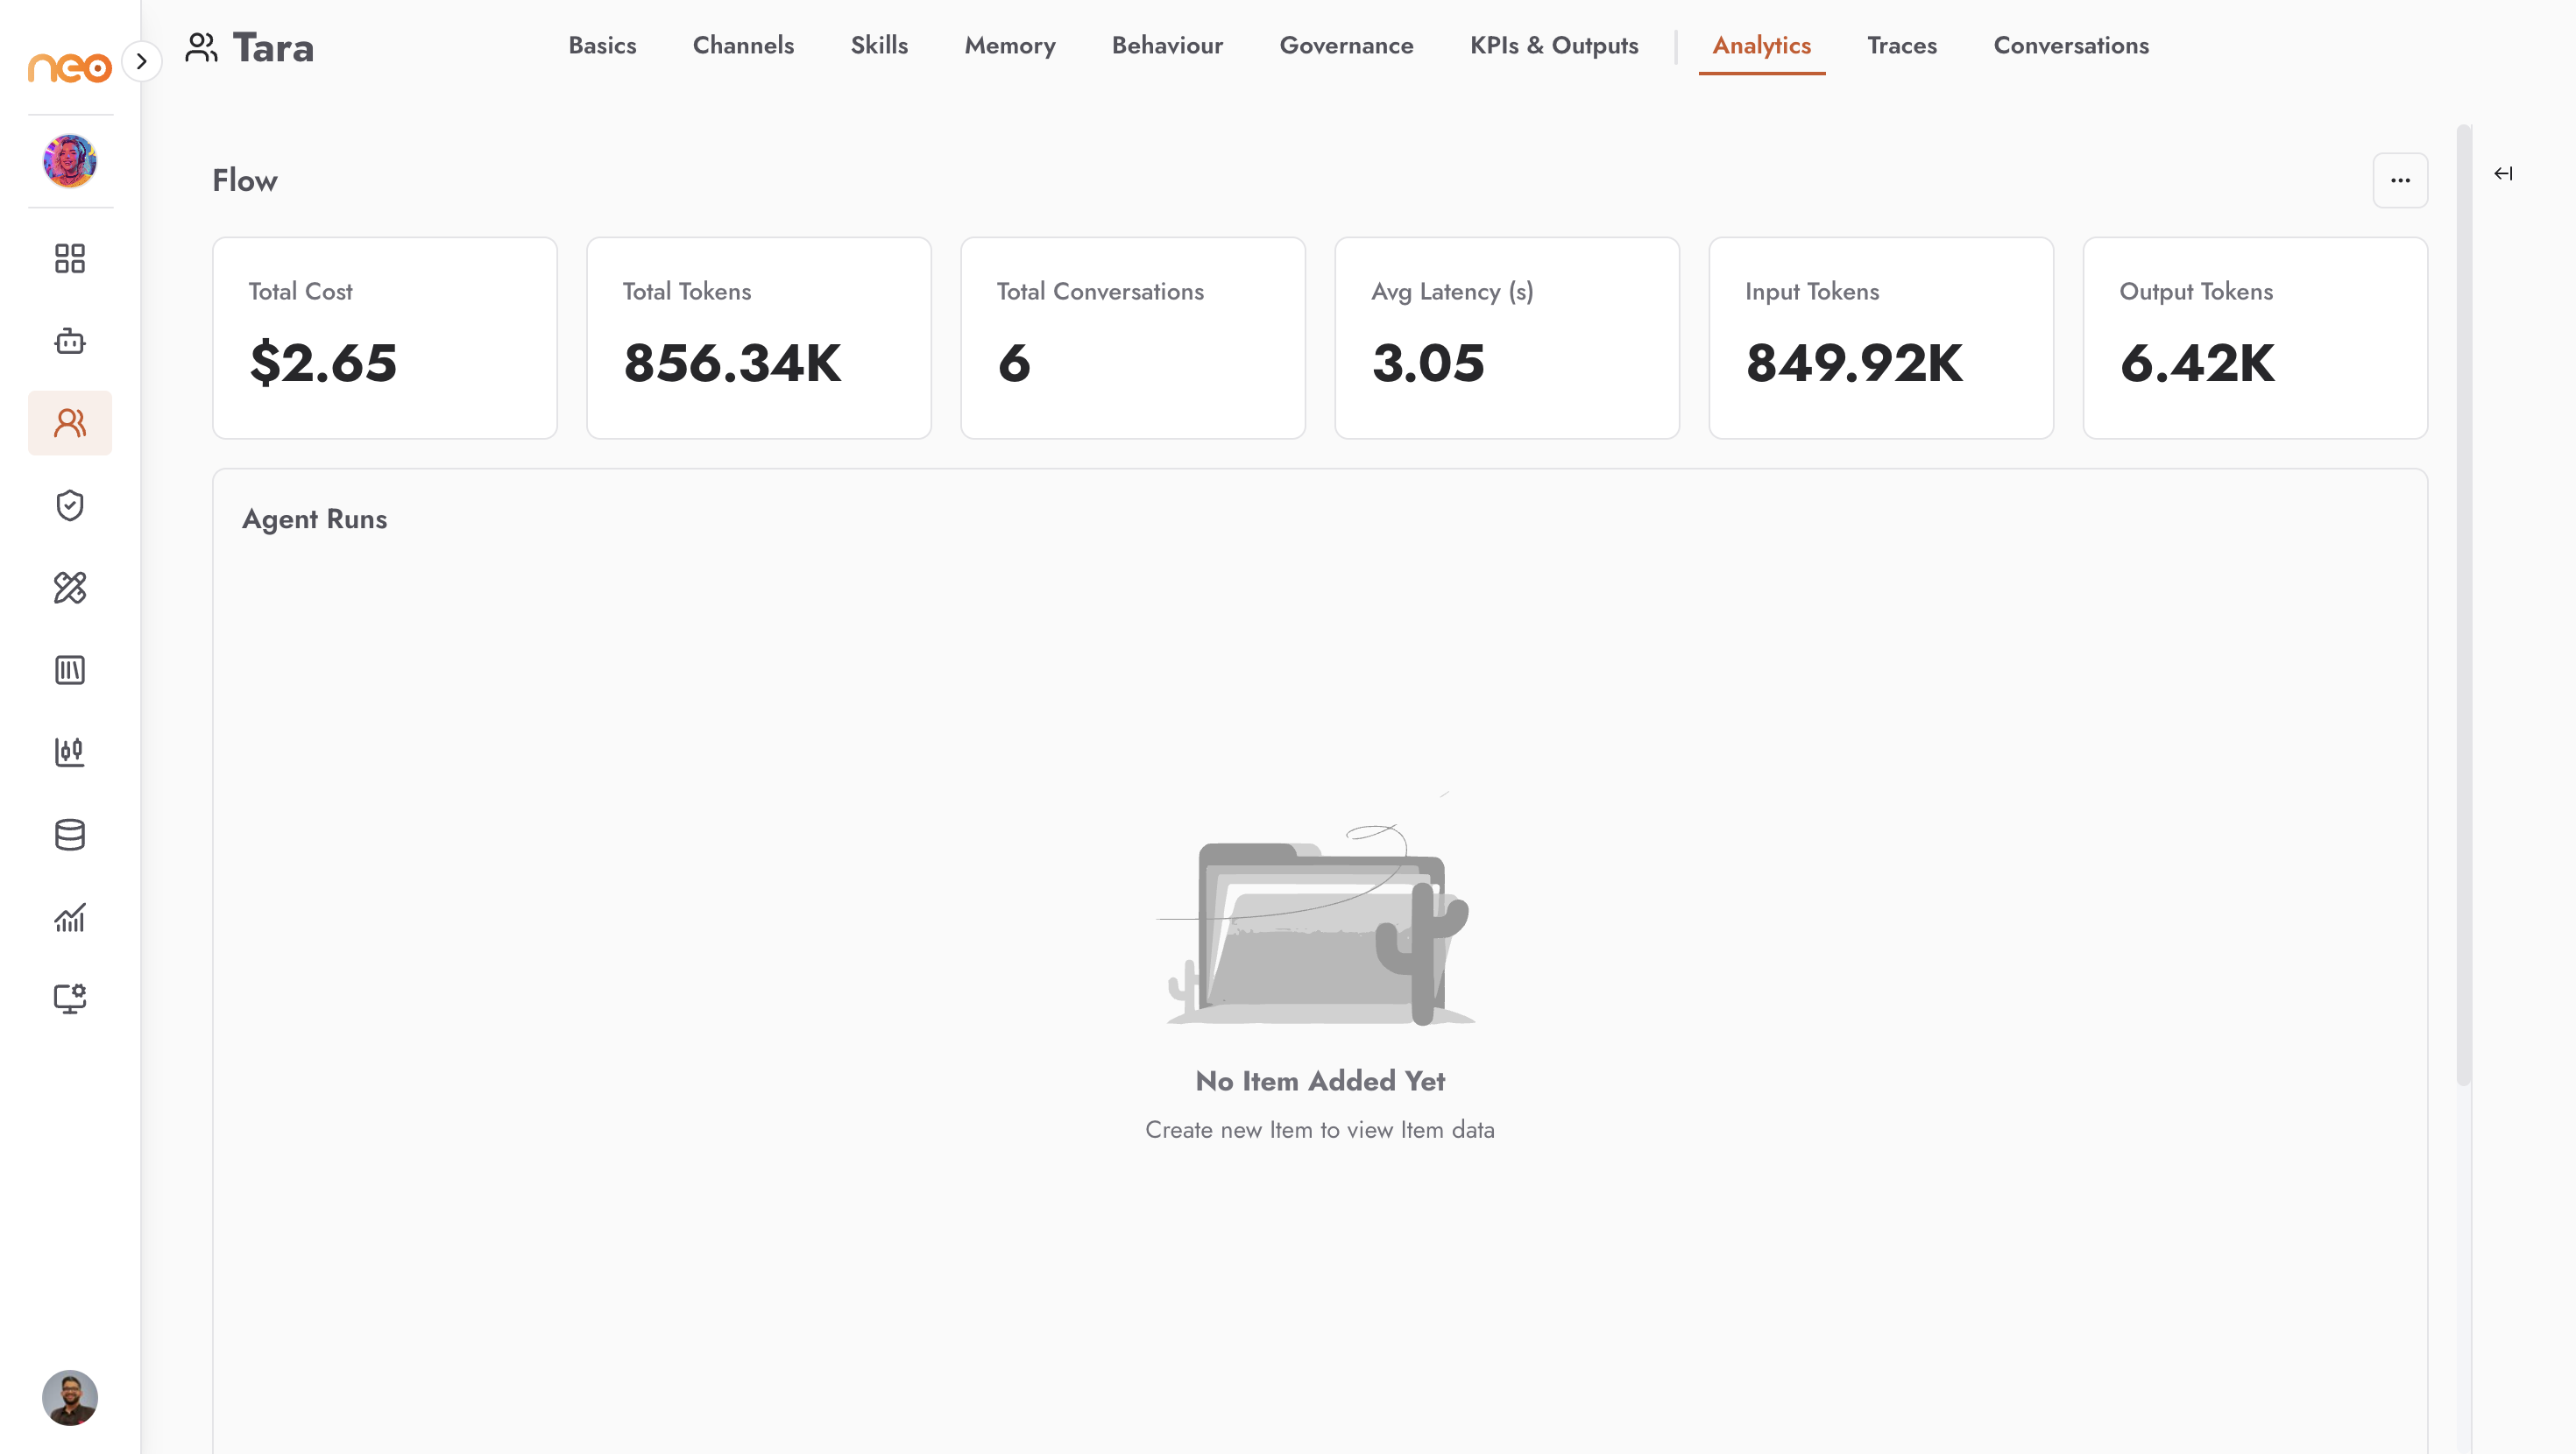
Once a Co-Worker is running, three tabs give live visibility into its behaviour and cost. They mirror the views in the Command Center, scoped to this Co-Worker.
Tab |
What it shows |
|---|---|
Analytics |
A live dashboard: Total Cost, Total Tokens, Total Conversations, and Average Latency, plus input and output token counts. An Agent Runs table links to the traces for each run, and cost and token usage are broken down by user and by model. Filter by email, model, and time range; refresh, auto-refresh, or export to PDF. |
Traces |
A paginated trace log. Open a trace to see the execution flow as a timeline of steps (spans), each with its input, output, metadata, duration, tokens, and cost. Skill invocations appear here as spans. Use Add to Dataset to capture a trace for evaluation. |
Conversations |
A list of sessions with their status and duration. Open one to see the chat history, any KPI results, the session metadata, and a translate option. |
The Analytics dashboard is where per-Co-Worker cost tracking lives — use it to monitor spend by user and model before and after a wider rollout.
Feedback from Users (Microsoft Teams)
On Microsoft Teams, when a user reacts to one of the Co-Worker’s messages — for example with a thumbs-up — the Co-Worker notices and uses it to adjust the tone of its next reply in the same conversation. The reaction shapes that one reply. This requires Reflection to be enabled on the Memory tab (it is on by default).
Note
Coming soon. How this feedback is surfaced in the interface is being finalised. Today the reaction influences the next reply; it is not yet shown as a separate score.