Platform Analytics
The Analytics tab gives Super Administrators a single view of token usage and cost across every workspace in the deployment. Use it for capacity planning, cost allocation, and spotting unusual consumption patterns before they become problems.
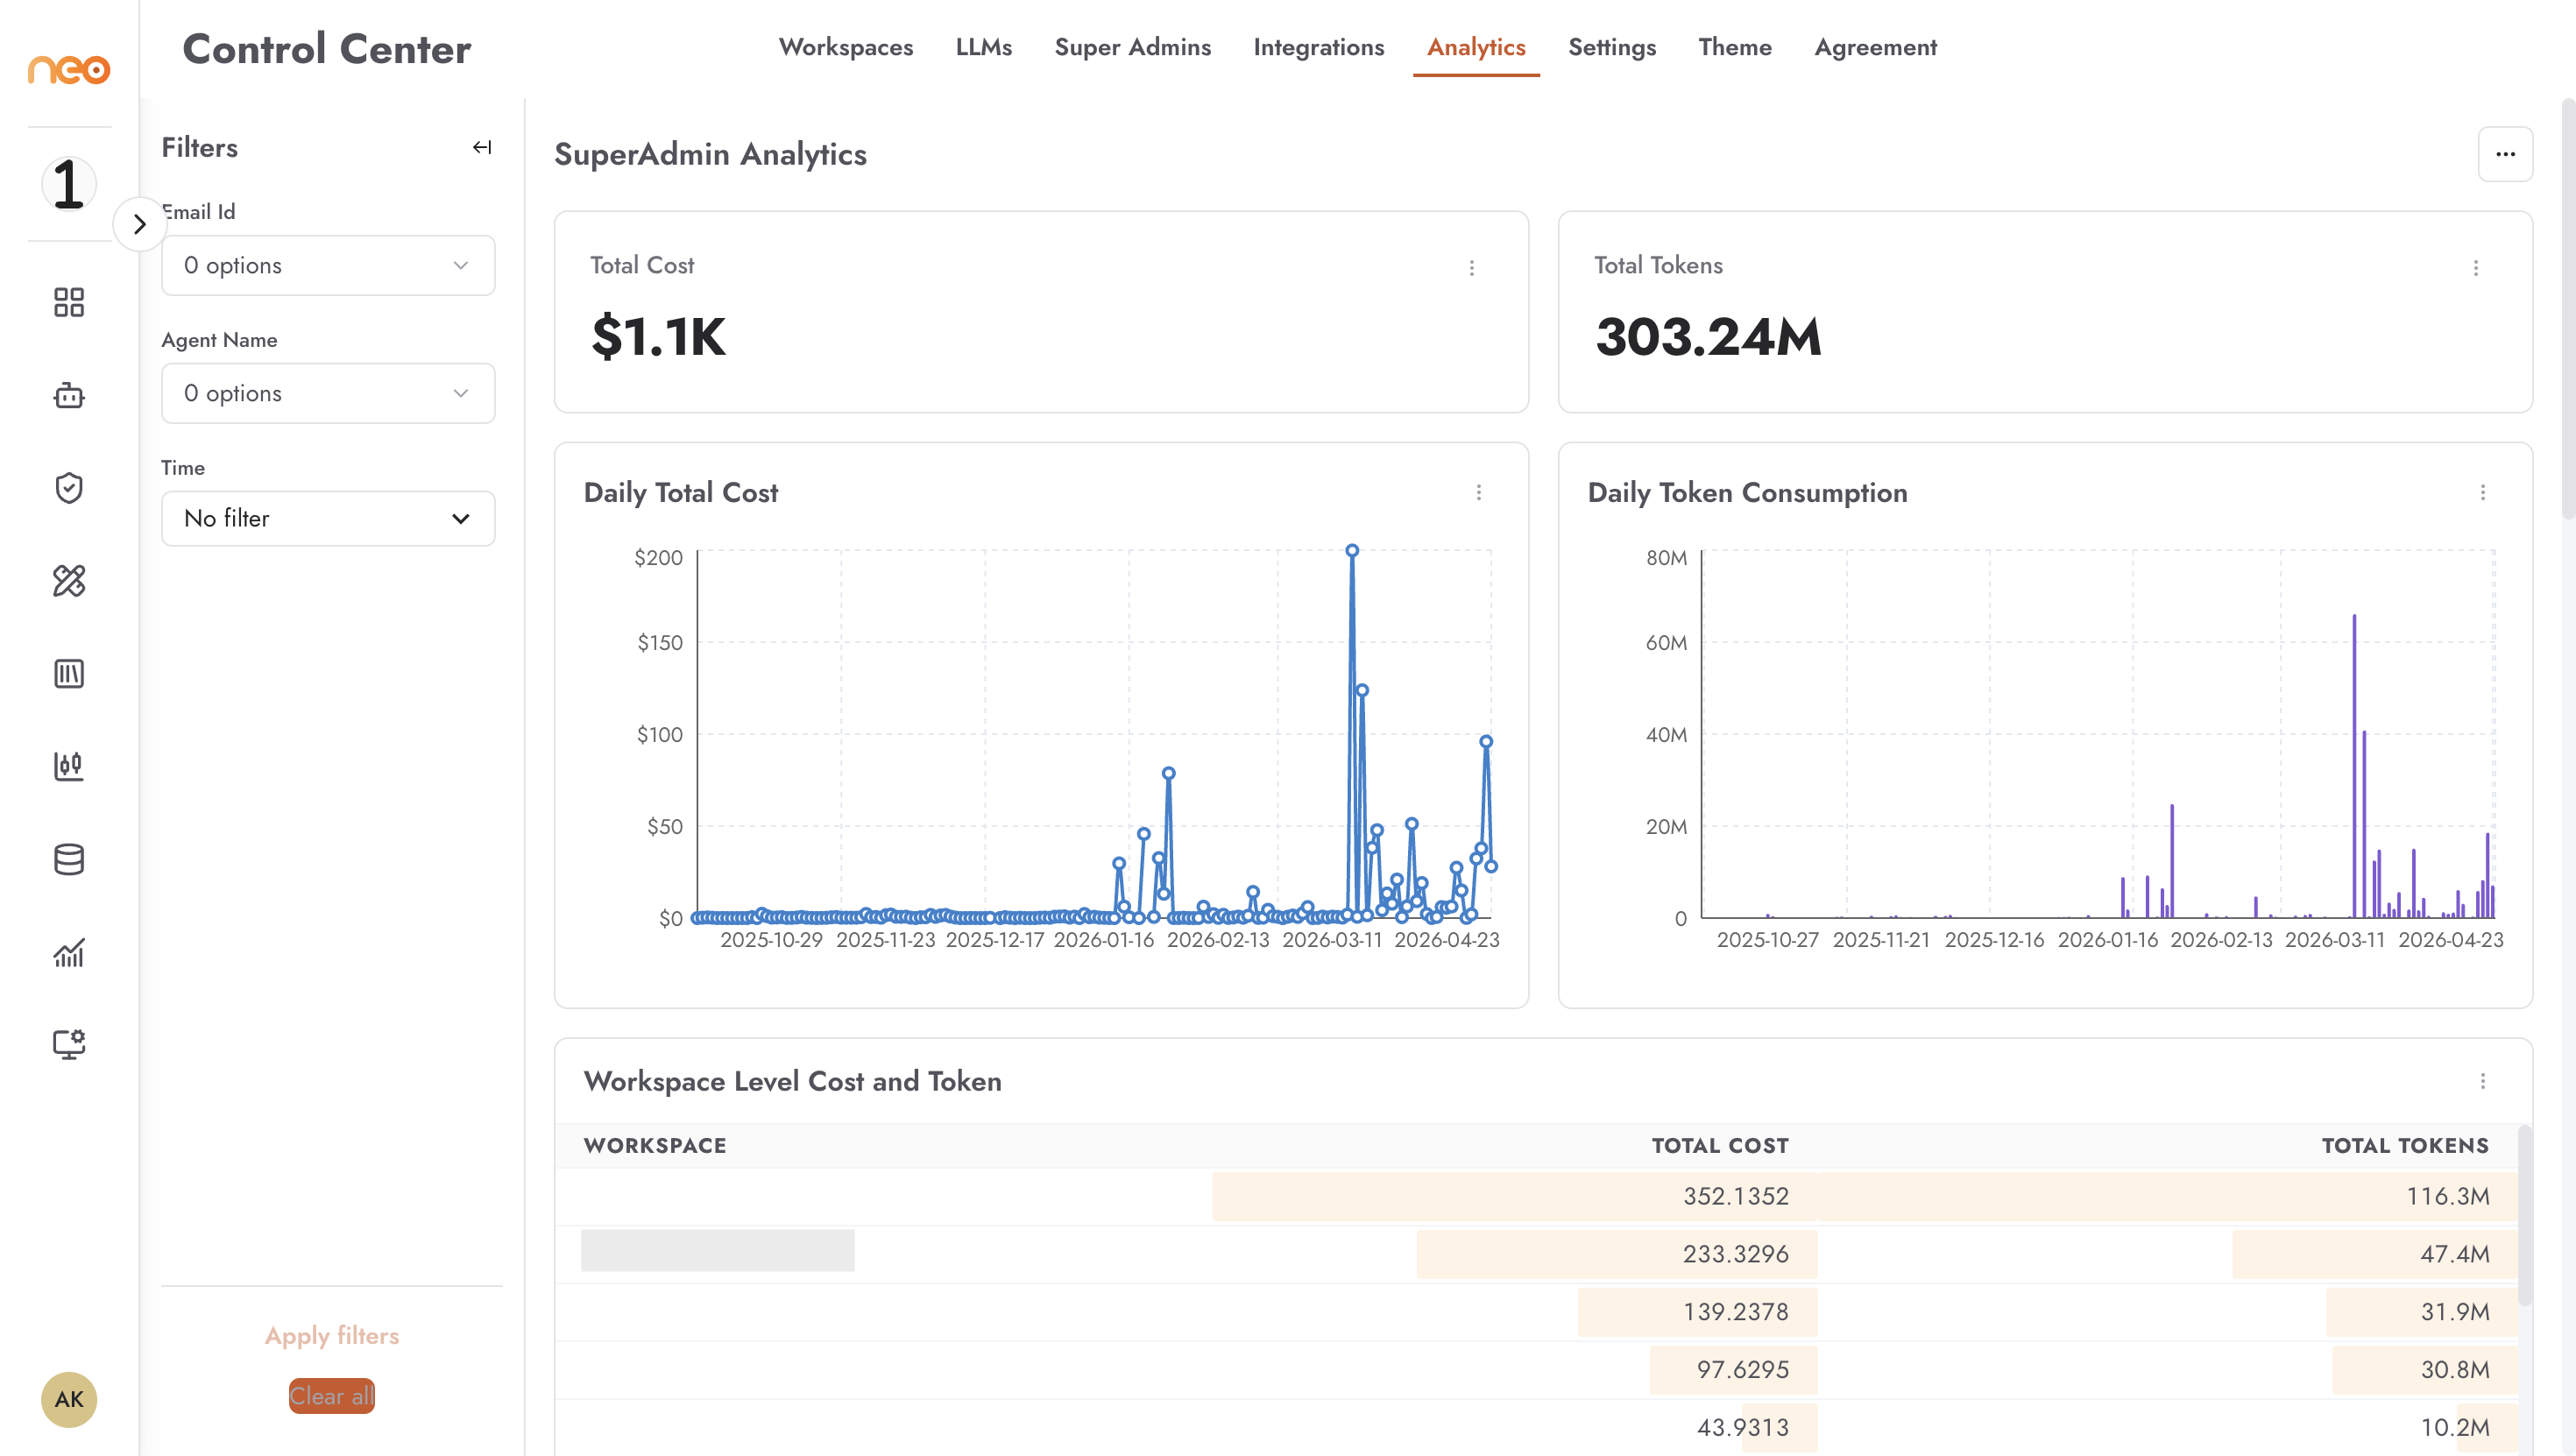
Summary Metrics
At the top of the dashboard, two aggregate numbers are always visible:
Total Cost — the combined spend across all workspaces for the selected period
Total Tokens — the total tokens consumed platform-wide
Filtering
The dashboard can be scoped down using any combination of the following filters:
Time — select a date range to analyse
UserID — narrow to a specific user across all workspaces
Agent Name — narrow to a specific agent
Workspace — view a single workspace or all workspaces at once
Detailed Breakdowns
Below the summary metrics, the dashboard provides:
Agents Level Cost and Token — a table listing cost and token consumption per agent, with workspace attribution, making it easy to identify the highest-consuming agents across the platform
Daily Total Cost — a time-series chart showing how spending has trended over the selected period
Total Tokens — a time-series chart showing token consumption over the same period
These breakdowns are useful for:
Identifying agents with unexpectedly high token consumption
Comparing usage across workspaces for chargeback or cost allocation
Detecting sudden spikes that could indicate a misconfigured agent or a runaway loop