Analytics
Analytics in OneByZero Neo is available at two levels:
Workspace-level Analytics — accessible from the Analytics item in the left sidebar. Shows aggregate cost and token usage across all agents in the workspace. Requires the
canViewAnalyticspermission.Per-agent Analytics — accessible from the Analytics tab within an individual agent. Shows metrics specific to that agent, with dashboard content that varies by agent type.
Both levels share the same dashboard framework and filter controls.
Dashboard Actions
A three-dot menu at the top right of the dashboard provides:
Refresh dashboard — reloads all charts and tables with the latest data.
Export to PDF — opens a print-ready version of the dashboard in a new browser tab and triggers the browser’s print dialog. Buttons and menus are stripped from the export.
Set auto-refresh interval — toggles a 30-second automatic refresh on or off. When active, the label changes to confirm the interval and offers a click to stop.
Workspace-Level Analytics
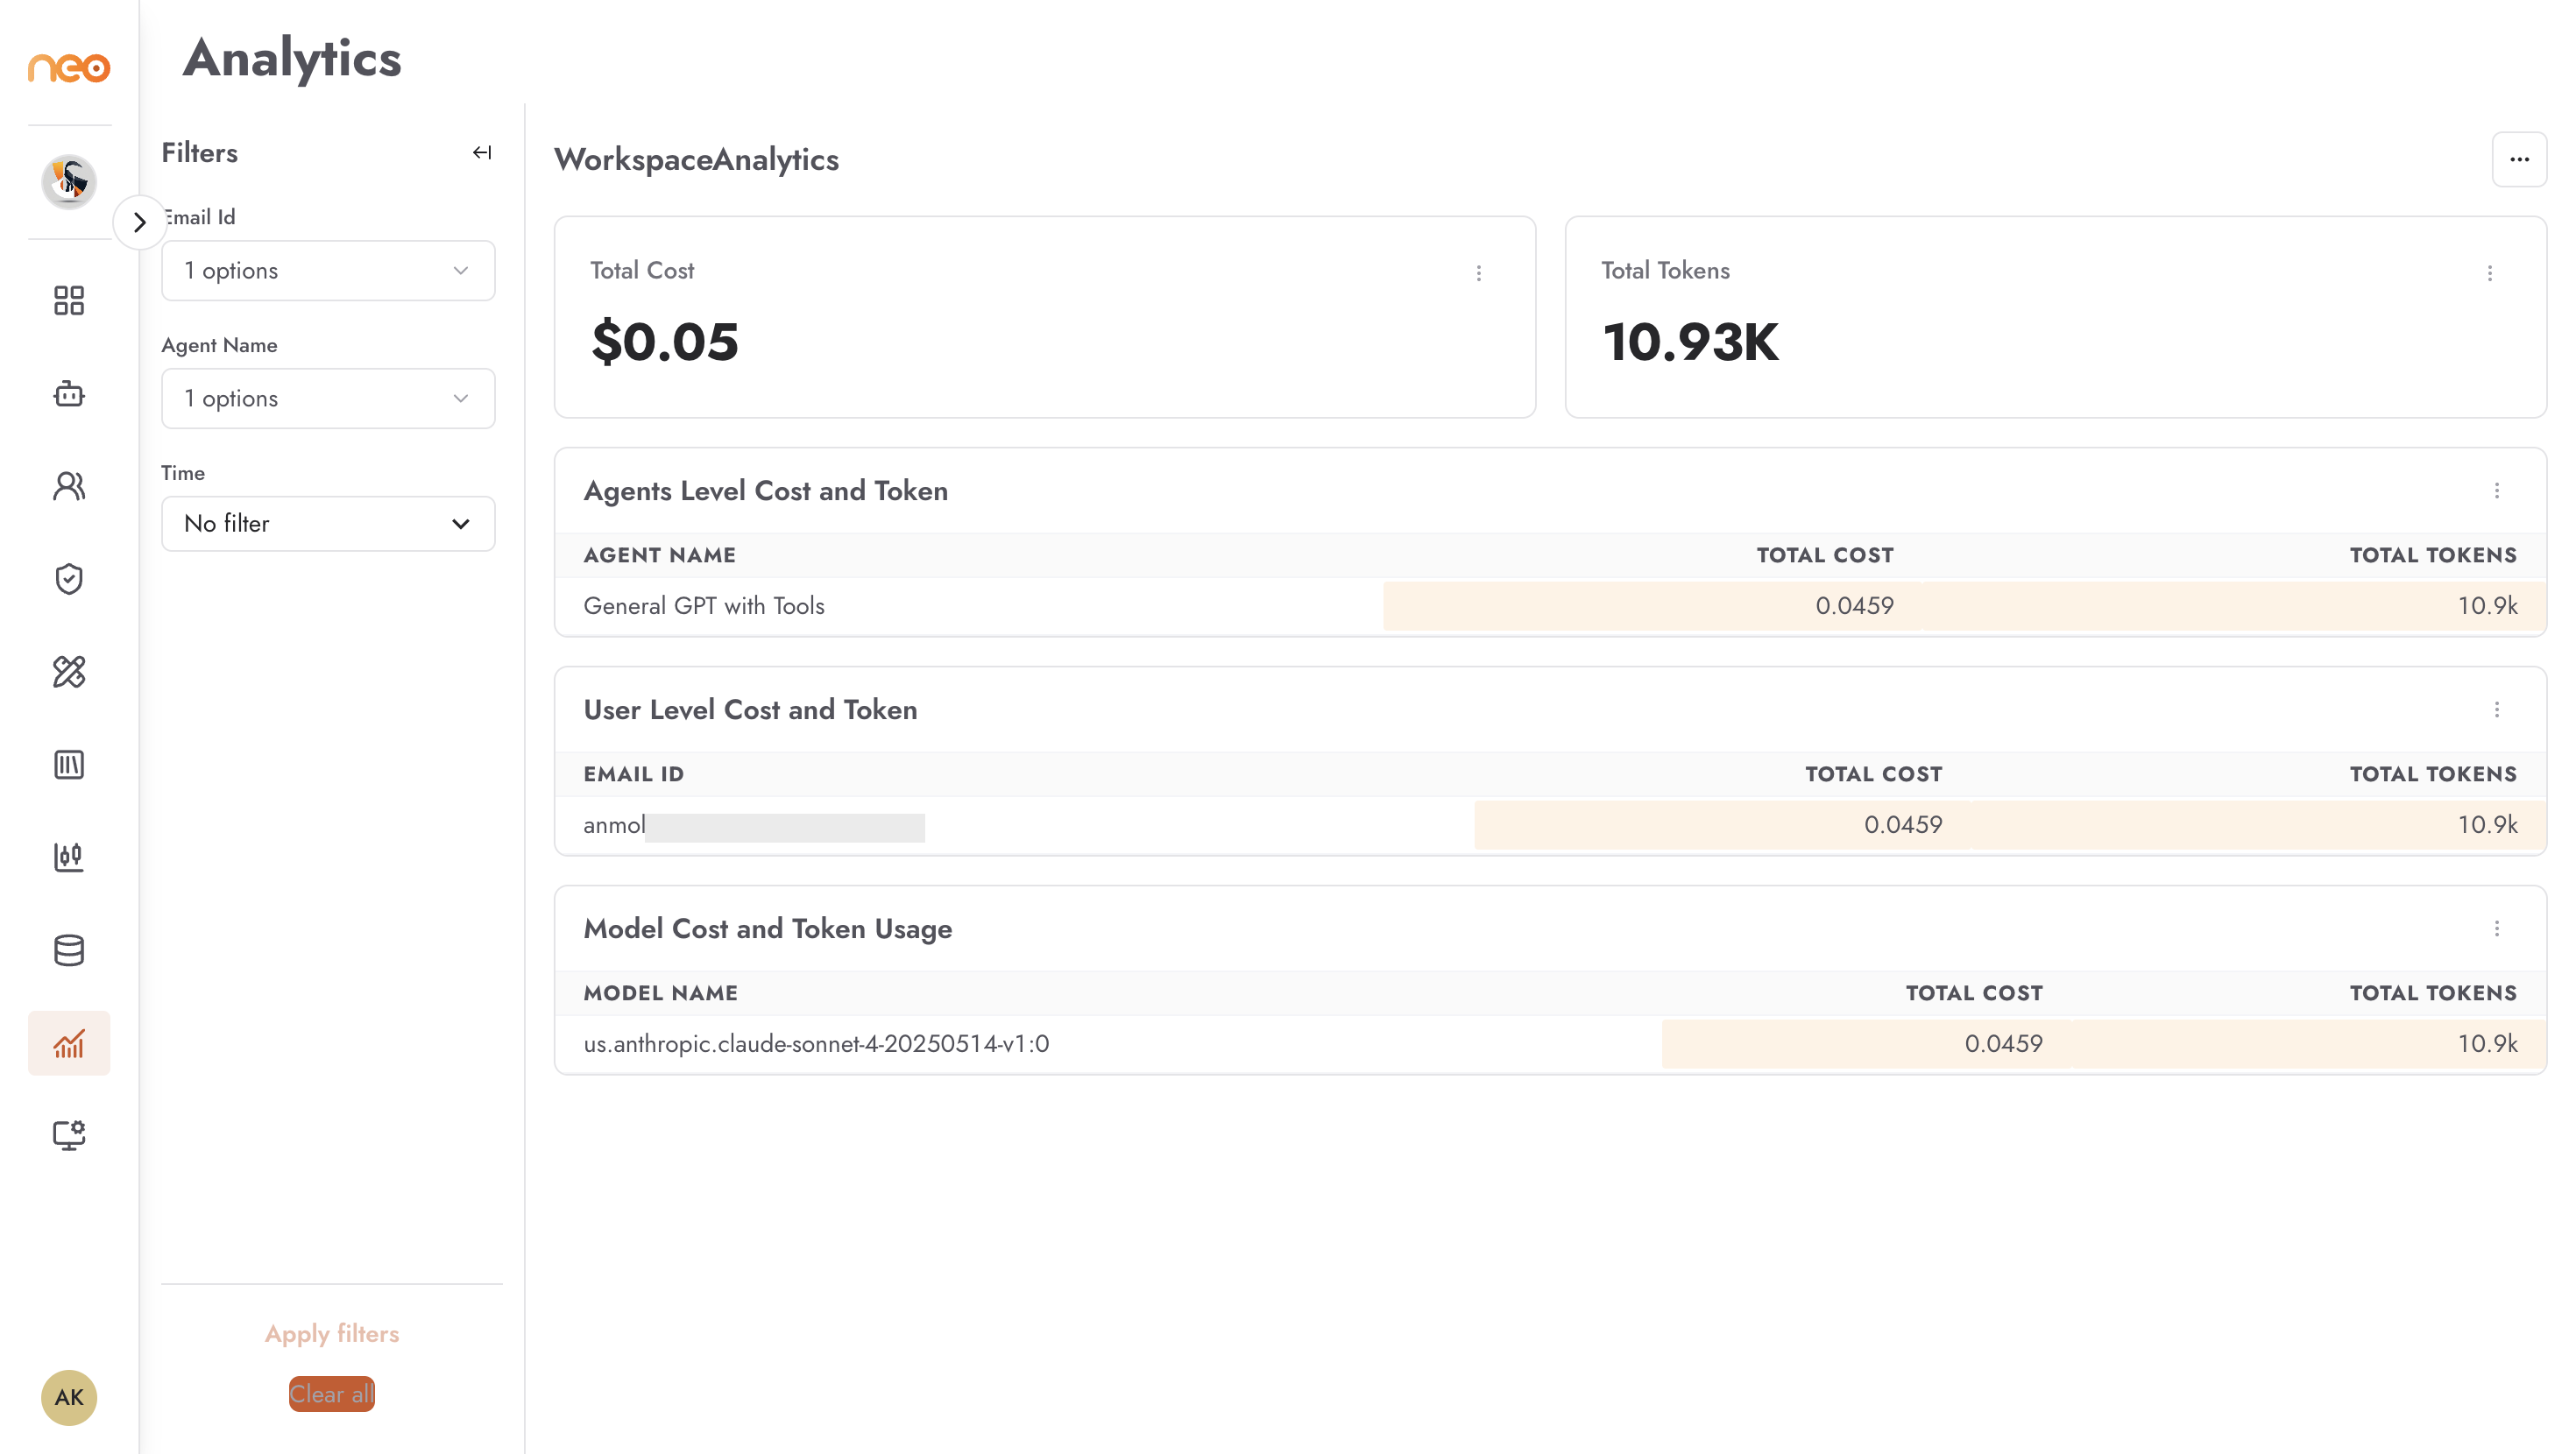
The workspace dashboard aggregates cost and token usage across all agents.
Summary KPIs
Total Cost — combined spend across all workspace agents for the selected period.
Total Tokens — total token consumption across all agents.
Breakdown tables
Agents Level Cost and Token — one row per agent showing Agent Name, Total Cost, and Total Tokens. Identifies which agents are driving the most consumption.
User Level Cost and Token — one row per user (Email Id) showing their Total Cost and Total Tokens. Useful for chargeback or identifying unusually high individual usage.
Model Cost and Token Usage — one row per LLM model showing Model Name, Total Cost, and Total Tokens. Useful for understanding which models are in active use and their relative cost.
Per-Agent Analytics
Per-agent dashboards show metrics for a single agent. The content of the dashboard varies by agent type.
Chatbot Agent
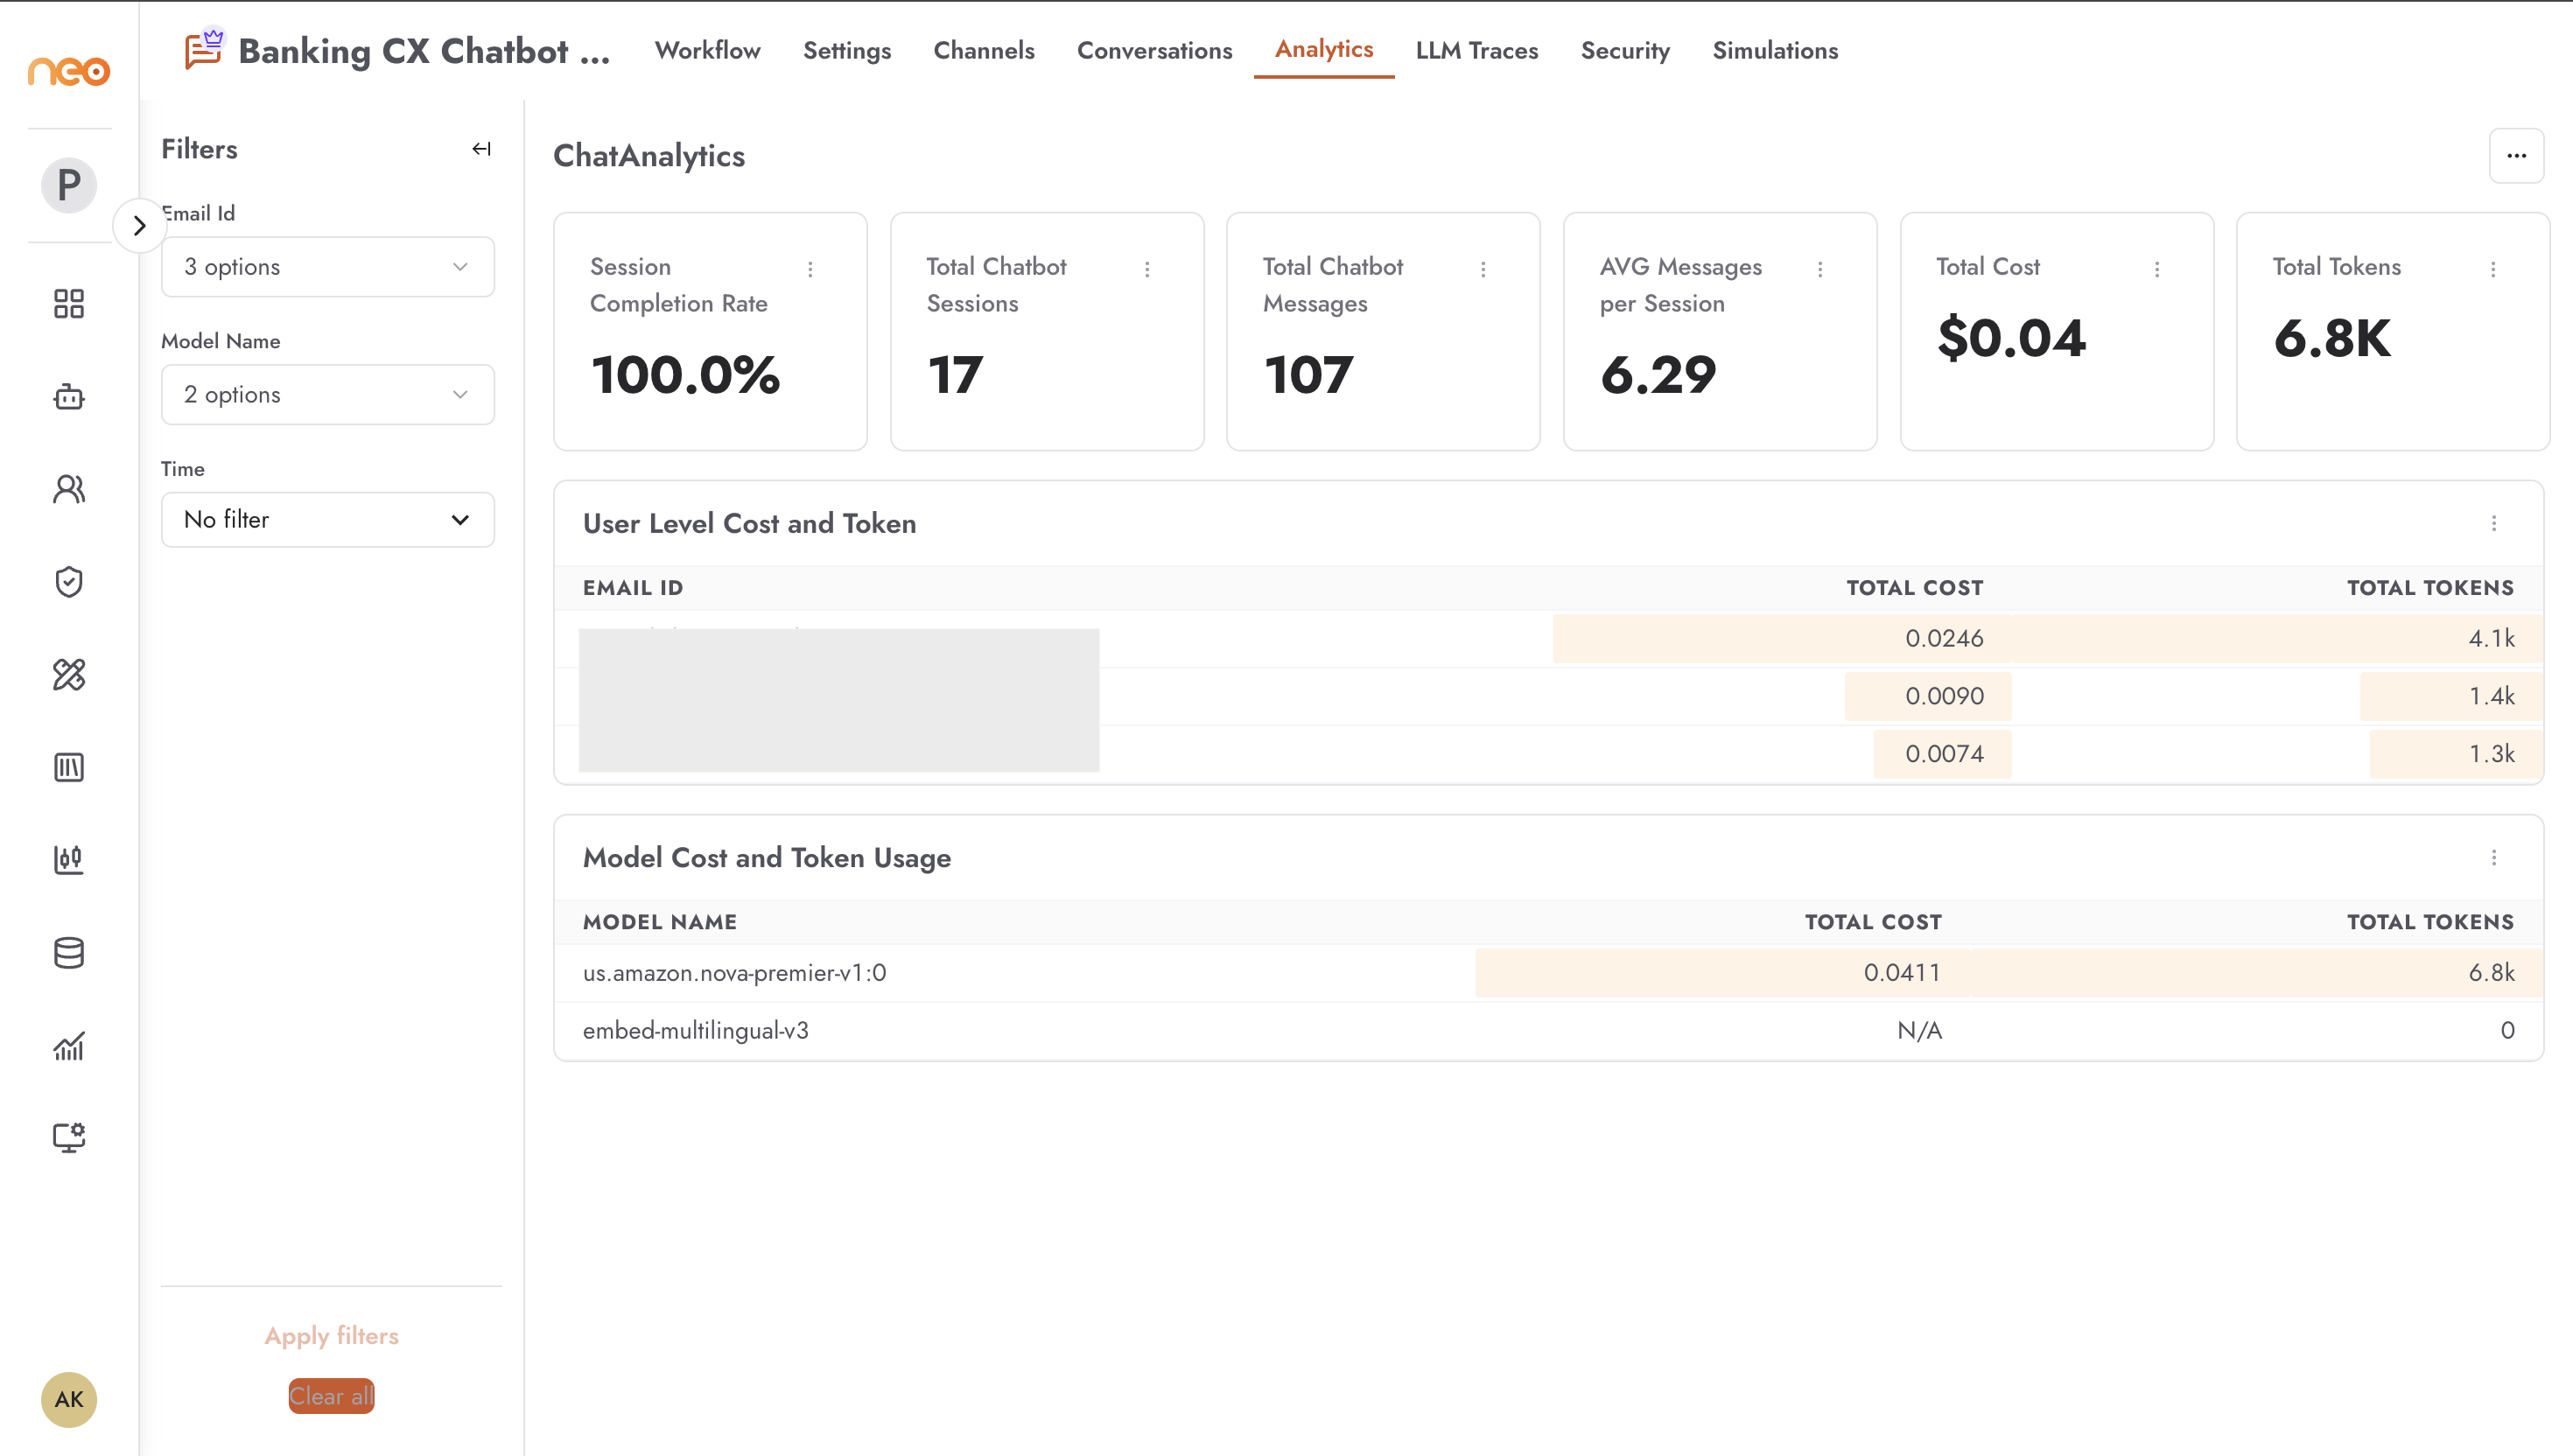
Six summary KPIs displayed in a single row:
Session Completion Rate — percentage of conversations that reached a completed state.
Total Chatbot Sessions — total number of conversation sessions in the selected period.
Total Chatbot Messages — total number of individual messages exchanged.
AVG Messages per Session — average number of messages per conversation.
Total Cost — combined LLM cost for this agent.
Total Tokens — total tokens consumed.
Breakdown tables:
User Level Cost and Token — cost and token usage per user.
Model Cost and Token Usage — cost and token usage per LLM model.
Agentic Flow Agent
Two summary KPIs:
Total Cost
Total Tokens
Breakdown tables:
Model Cost and Token Usage
User Level Cost and Token
Voice Agent
Five summary KPIs:
Total Voice Unique Users — number of distinct callers.
Voice Call Count — total number of calls handled.
Average Voice Call Duration — mean call length in seconds.
Total Cost
Total Tokens
Breakdown tables:
User Level Cost and Token
Model Cost and Token Usage
Additional charts:
Last 7 Days Call Analysis — a dual-line time-series chart showing daily call count and unique callers over the last 7 days.
Voice Call Status — a pie chart showing the distribution of call outcomes (e.g. completed, failed, in-progress).
Voice Call Duration — a bar chart bucketing calls by duration: 0–1 min, 1–2 min, 2–5 min, 5–10 min, 10+ min, Unknown.